Analysis of FWC win-statistics
The picture below shows the percentages of wins for each
role Friedrich, Elisabeth, Maria Theresa, Mme. Pompadour over the course of the past FWCs.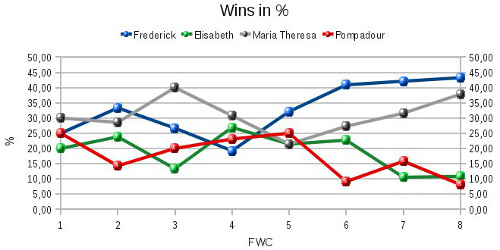 What can be seen?
1. In the 1st, 4th and 5th championship, the percentages between the four roles are almost equal, deviating by not more than ca. 5%
from the mean average. Remember, that the number of games being played is far too less to guarantee a robust average. For instance, in the 1st FWC, the wins were distributed 5, 4, 6 ,5.
Possible reasons?
The TC-coefficient. The easiest way to look at the role of the fate-cards is the TC-coeffient (total number of TCs dealt to Prussia/Hanover divided by total number of TCs dealt to the attackers). However, the average of this coefficient is quite stable throughout the tournament, ranging from 0.65 to 0.68. One minimum coincides with low Prussian win percentag in th 4th FWC, while the other minimum is in negative correlation with the high number of wins of the 8th FWC. — So, the TC-coefficient does not explain anything.
 a) The low percentage of Prussian late subsidy reductions of the 4th FWC correlates with the low percentage of Prussian wins. b) Similarly, the Russian negative peak of the 3rd FWC correlates with the low number of Russian wins; and the Russian high peak of the 4th FWC correlates with the high number of Russian wins. c) The "France-out" curve does not correlate at all with anything. d) There is no explanation for the win-statistics of the 7th and 8th FWC. Even more, the low number of Prussian late subsidy reductions of the 8th FWC is negative correlated to the high number of Prussian wins. Same is true for the negative French peak at the 7th FWc. Number of newbies? The number of newbies were quite different in each FWC. In the 8th, there were 11 newbies (31%), while in the 7th there was only 1 (6.3 %). Basically, a Prussian win can be explained by a high number of newbies playing against a more experienced Prussian player. But since the percentages of Prussian wins in the 7th and 8th FWC are almost identical, it does not seem to be the cause here. Number of fill-in players? Similarly, a fill-in player (needed to run the tournament format) could affect the statistics. However, since the fill-in players performed average or even above-average in every FWC, they do not seem to distort the statistics. Improved Prussian skills. One explanation for the increased Prussian win percentage is quite obvious: During the last years, more and more players (who became somehow FWC veterans) have perfectioned their Prussian skills so much that even extreme fates as an quite early subsidy reduction does not mean their breakdown. It seems that until the 5th FWC we had a lot of experienced players, but not too many Prussian experts. Therefore, the wins were quite equally distributed until then. After that the number of players with expert skills for playing Prussia increased. But? Having a high Prussian win ratio is one thing. But why differ the other 3 ratios so widespread? If the 4 roles would win by 40%-20%-20%-20%, things would not be so extreme. But the 8th FWC showed a 43%-11%-38%-8% distribution. Why does Maria Theresa win significantly more often than Elisabeth and Pompadour? Possible answers are: a) Even non-expert Prussian players know how to stop Russia and France, but not how to stop Austria. b) Since Austria does not drop out, it has better chances to win a long game (after turn 15). The FWC-format rewards every Prussian turn by 0.5 points. Therefore it is better to lose late than early. (In the standard Friedrich, a loss is just a loss.) So, it is better to stop Russia and France for sure (both of them can win fast!) than to play a defense where the chances on collapse are equal for each front (but not equal in their timing). Maybe the format does influence the Prussian strategy, distorting the statistics thereby. Conclusion
The first 5 FWCs demonstrate tht Friedrich is well balanced for 4 experienced players. Since the 6th or 7th FWC, it seems like
expert Prussian skills result in a Prussian win ratio significantly above 25%. Why the other 3 win ratios are not equally distributed, is
not so clear; one reason might the FWC format rules itself.
|